Creating a Pivot Table
Contents
Creating a Pivot Table
Pivot Tables are one of the most used features in Excel. You can point to a large table of data and interactively group the data and calculate multiple statistics on each of the groups and sub groups. Pandas makes it easy to do similar functionalities using the pivot_table function. There are multiple options to achieve similar and even more powerful calculations with other Pandas functions, which we will cover later, however, pivot_table is the most straight comparison to the one in Excel, and therefore, we will start with it

Loading Data
As always, we will start with loading some data set (using the great tutorial from pbpython)
import pandas as pd
# import numpy as np

sales_funnel = (
    pd
    .read_excel("https://pbpython.com/extras/sales-funnel.xlsx")
)

sales_funnel.head()
| Account | Name | Rep | Manager | Product | Quantity | Price | Status | |
|---|---|---|---|---|---|---|---|---|
| 0 | 714466 | Trantow-Barrows | Craig Booker | Debra Henley | CPU | 1 | 30000 | presented |
| 1 | 714466 | Trantow-Barrows | Craig Booker | Debra Henley | Software | 1 | 10000 | presented |
| 2 | 714466 | Trantow-Barrows | Craig Booker | Debra Henley | Maintenance | 2 | 5000 | pending |
| 3 | 737550 | Fritsch, Russel and Anderson | Craig Booker | Debra Henley | CPU | 1 | 35000 | declined |
| 4 | 146832 | Kiehn-Spinka | Daniel Hilton | Debra Henley | CPU | 2 | 65000 | won |
Simple Pivot Table
The simplest usage is to define what will be the index of the pivot table, which is equivalent to Rows in Excel pivot table. All the numeric values will be added automatically and their average will be calculated.
(
    sales_funnel
    .pivot_table(index=["Name"])
)
| Account | Price | Quantity | |
|---|---|---|---|
| Name | |||
| Barton LLC | 740150 | 35000 | 1.000000 |
| Fritsch, Russel and Anderson | 737550 | 35000 | 1.000000 |
| Herman LLC | 141962 | 65000 | 2.000000 |
| Jerde-Hilpert | 412290 | 5000 | 2.000000 |
| Kassulke, Ondricka and Metz | 307599 | 7000 | 3.000000 |
| Keeling LLC | 688981 | 100000 | 5.000000 |
| Kiehn-Spinka | 146832 | 65000 | 2.000000 |
| Koepp Ltd | 729833 | 35000 | 2.000000 |
| Kulas Inc | 218895 | 25000 | 1.500000 |
| Purdy-Kunde | 163416 | 30000 | 1.000000 |
| Stokes LLC | 239344 | 7500 | 1.000000 |
| Trantow-Barrows | 714466 | 15000 | 1.333333 |
Multi-Index
We can define multiple columns as index and create a multi-index.
(
    sales_funnel
    .pivot_table(index=["Manager","Rep"])
)
| Account | Price | Quantity | ||
|---|---|---|---|---|
| Manager | Rep | |||
| Debra Henley | Craig Booker | 720237.0 | 20000.000000 | 1.250000 |
| Daniel Hilton | 194874.0 | 38333.333333 | 1.666667 | |
| John Smith | 576220.0 | 20000.000000 | 1.500000 | |
| Fred Anderson | Cedric Moss | 196016.5 | 27500.000000 | 1.250000 |
| Wendy Yule | 614061.5 | 44250.000000 | 3.000000 |
Choosing Values
The Account number is also a numeric column, however, it is not relevant for us to look at in the pivot table, and the same goes for the Quantity column. Therefore, we can choose to take only the Price column for our pivot table.
(
    sales_funnel
    .pivot_table(
        index=["Manager","Rep"],
        values=["Price"]
    )
)
| Price | ||
|---|---|---|
| Manager | Rep | |
| Debra Henley | Craig Booker | 20000.000000 |
| Daniel Hilton | 38333.333333 | |
| John Smith | 20000.000000 | |
| Fred Anderson | Cedric Moss | 27500.000000 |
| Wendy Yule | 44250.000000 |
Chossing aggregation function
We want to see the sum of the sales of each sales rep and not the average size of the sales. Let’s request to use the sum as the aggregation function. Other functions are mean (default), median count, min, max, var, std, and prod
(
    sales_funnel
    .pivot_table(
        index=["Manager","Rep"],
        values=["Price"],
        aggfunc='sum'
    )
)
| Price | ||
|---|---|---|
| Manager | Rep | |
| Debra Henley | Craig Booker | 80000 |
| Daniel Hilton | 115000 | |
| John Smith | 40000 | |
| Fred Anderson | Cedric Moss | 110000 |
| Wendy Yule | 177000 |
Choosing Columns
The Columns selection in Excel is similar to the one in pivot table in Pandas. We can add a breakdown of the sales per product, by adding it as the Columns of the pivot table
(
    sales_funnel
    .pivot_table(
        index=["Manager","Rep"],
        values=["Price"],
        columns=["Product"],
        aggfunc='sum'
    )
)
| Price | |||||
|---|---|---|---|---|---|
| Product | CPU | Maintenance | Monitor | Software | |
| Manager | Rep | ||||
| Debra Henley | Craig Booker | 65000.0 | 5000.0 | NaN | 10000.0 |
| Daniel Hilton | 105000.0 | NaN | NaN | 10000.0 | |
| John Smith | 35000.0 | 5000.0 | NaN | NaN | |
| Fred Anderson | Cedric Moss | 95000.0 | 5000.0 | NaN | 10000.0 |
| Wendy Yule | 165000.0 | 7000.0 | 5000.0 | NaN | |
Removing Null (NaN) values
To make the table cleaner we can replace all the NaN values with 0
(
    sales_funnel
    .pivot_table(
        index=["Manager","Rep"],
        values=["Price"],
        columns=["Product"],
        aggfunc='sum',
        fill_value=0
    )
)
| Price | |||||
|---|---|---|---|---|---|
| Product | CPU | Maintenance | Monitor | Software | |
| Manager | Rep | ||||
| Debra Henley | Craig Booker | 65000 | 5000 | 0 | 10000 |
| Daniel Hilton | 105000 | 0 | 0 | 10000 | |
| John Smith | 35000 | 5000 | 0 | 0 | |
| Fred Anderson | Cedric Moss | 95000 | 5000 | 0 | 10000 |
| Wendy Yule | 165000 | 7000 | 5000 | 0 | |
We can add more values such as Quantity
(
    sales_funnel
    .pivot_table(
        index=["Manager","Rep"],
        values=["Price","Quantity"],
        columns=["Product"],
        aggfunc='sum',
        fill_value=0
    )
)
| Price | Quantity | ||||||||
|---|---|---|---|---|---|---|---|---|---|
| Product | CPU | Maintenance | Monitor | Software | CPU | Maintenance | Monitor | Software | |
| Manager | Rep | ||||||||
| Debra Henley | Craig Booker | 65000 | 5000 | 0 | 10000 | 2 | 2 | 0 | 1 |
| Daniel Hilton | 105000 | 0 | 0 | 10000 | 4 | 0 | 0 | 1 | |
| John Smith | 35000 | 5000 | 0 | 0 | 1 | 2 | 0 | 0 | |
| Fred Anderson | Cedric Moss | 95000 | 5000 | 0 | 10000 | 3 | 1 | 0 | 1 |
| Wendy Yule | 165000 | 7000 | 5000 | 0 | 7 | 3 | 2 | 0 | |
Showing Totals
The default pivot table in Pandas is not showing the totals of the columns or rows, however, we can add it with margins=True. It will add All both for the columns at the bottom and for the rows on the right.
(
    sales_funnel
    .pivot_table(
        index=["Manager","Rep"],
        values=["Price"],
        columns=["Product"],
        aggfunc='sum',
        fill_value=0,
        margins=True
    )
)
| Price | ||||||
|---|---|---|---|---|---|---|
| Product | CPU | Maintenance | Monitor | Software | All | |
| Manager | Rep | |||||
| Debra Henley | Craig Booker | 65000 | 5000 | 0 | 10000 | 80000 |
| Daniel Hilton | 105000 | 0 | 0 | 10000 | 115000 | |
| John Smith | 35000 | 5000 | 0 | 0 | 40000 | |
| Fred Anderson | Cedric Moss | 95000 | 5000 | 0 | 10000 | 110000 |
| Wendy Yule | 165000 | 7000 | 5000 | 0 | 177000 | |
| All | 465000 | 22000 | 5000 | 30000 | 522000 | |
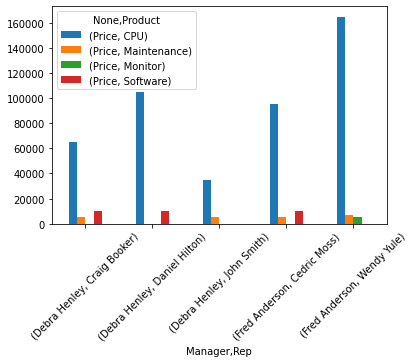
Visualize the pivot table
we can see the values in a graph
(
    sales_funnel
    .pivot_table(
        index=["Manager","Rep"],
        values=["Price"],
        columns=["Product"],
        aggfunc='sum',
        fill_value=0
    )
    .plot(
        kind='bar',
        rot=45
    )
);
Multiple Aggregation Functions
You can define multiple Aggregation functions for a value or different Aggregation functions for different values. You can either pass an array of function or a dictionary for different columns.
(
    sales_funnel
    .pivot_table(
        index=["Manager","Rep"],
        values=["Price","Quantity"],
        columns=["Product"],
        aggfunc={
            "Price" :['sum','median'],
            "Quantity" : 'sum'
        },
        fill_value=0
    )
)
| Price | Quantity | ||||||||||||
|---|---|---|---|---|---|---|---|---|---|---|---|---|---|
| median | sum | sum | |||||||||||
| Product | CPU | Maintenance | Monitor | Software | CPU | Maintenance | Monitor | Software | CPU | Maintenance | Monitor | Software | |
| Manager | Rep | ||||||||||||
| Debra Henley | Craig Booker | 32500 | 5000 | 0 | 10000 | 65000 | 5000 | 0 | 10000 | 2 | 2 | 0 | 1 |
| Daniel Hilton | 52500 | 0 | 0 | 10000 | 105000 | 0 | 0 | 10000 | 4 | 0 | 0 | 1 | |
| John Smith | 35000 | 5000 | 0 | 0 | 35000 | 5000 | 0 | 0 | 1 | 2 | 0 | 0 | |
| Fred Anderson | Cedric Moss | 47500 | 5000 | 0 | 10000 | 95000 | 5000 | 0 | 10000 | 3 | 1 | 0 | 1 |
| Wendy Yule | 82500 | 7000 | 5000 | 0 | 165000 | 7000 | 5000 | 0 | 7 | 3 | 2 | 0 | |
Format the values
A pivot table is simply a dataframe in Pandas and you can format the values similar to the formating of any other dataframe. We will cover Styling in a dedicated section, however, here is a quick preview to formating the the Price column as currency
(
    sales_funnel
    .pivot_table(
        index=["Manager","Rep"],
        values=["Price"],
        aggfunc='sum',
        fill_value=0
    )
    .style
    .format({'Price':'${0:,.0f}'})
)
| Price | ||
|---|---|---|
| Manager | Rep | |
| Debra Henley | Craig Booker | $80,000 |
| Daniel Hilton | $115,000 | |
| John Smith | $40,000 | |
| Fred Anderson | Cedric Moss | $110,000 |
| Wendy Yule | $177,000 |