Reading Data from Web Sites
Contents
Reading Data from Web Sites
Many times you want to add external data to your analysis. External data is often found in external web sites, usually in the format of an HTML table. You can import HTML directly into Excel using “Import”.
In this notebook, we will learn how to use pandas read_html to load tables from web site with ease, including cases where the data is complex to retrieve.
%pip install lxml requests
Requirement already satisfied: lxml in /opt/hostedtoolcache/Python/3.7.13/x64/lib/python3.7/site-packages (4.8.0)
Requirement already satisfied: requests in /opt/hostedtoolcache/Python/3.7.13/x64/lib/python3.7/site-packages (2.27.1)
Requirement already satisfied: idna<4,>=2.5 in /opt/hostedtoolcache/Python/3.7.13/x64/lib/python3.7/site-packages (from requests) (3.3)
Requirement already satisfied: certifi>=2017.4.17 in /opt/hostedtoolcache/Python/3.7.13/x64/lib/python3.7/site-packages (from requests) (2022.5.18.1)
Requirement already satisfied: charset-normalizer~=2.0.0 in /opt/hostedtoolcache/Python/3.7.13/x64/lib/python3.7/site-packages (from requests) (2.0.12)
Requirement already satisfied: urllib3<1.27,>=1.21.1 in /opt/hostedtoolcache/Python/3.7.13/x64/lib/python3.7/site-packages (from requests) (1.26.9)
WARNING: There was an error checking the latest version of pip.
Note: you may need to restart the kernel to use updated packages.
Loading HTML data
We will load a few tables from simple sites as well as complex ones
import warnings
warnings.filterwarnings('ignore')
import pandas as pd
import numpy as np
Loading from simple web sites
If you have a simple web page with a few tables, you can pass the URL of the page to Pandas and call read_html.
url = 'https://en.wikipedia.org/wiki/The_Championships,_Wimbledon'
dfs = (
    pd
    .read_html(url)
)
read_html is returning a list of all the tables in the page. We can scroll through the content of the tables on that page, by changing the index in the list. We can print the second element (index 1 in the list), we will get the table with the prize amounts for the Wimbeldon Tennis competition.
dfs[1]
| 0 | 1 | 2 | 3 | 4 | 5 | 6 | 7 | 8 | 9 | 10 | 11 | |
|---|---|---|---|---|---|---|---|---|---|---|---|---|
| 0 | 2021 Event | W | F | SF | QF | Round of 16 | Round of 32 | Round of 64 | Round of 1281 | Q3 | Q2 | Q1 |
| 1 | Singles | £1,700,000 | £900,000 | £465,000 | £300,000 | £181,000 | £115,000 | £75,000 | £48,000 | £25,500 | £15,500 | £8,500 |
| 2 | Doubles | £480,000 | £240,000 | £120,000 | £60,000 | £30,000 | £19,000 | £12,000 | NaN | NaN | NaN | NaN |
Loading from complex web sites
Many times pages will be more complex and we can still extract the relevant data.
url = 'https://ncov2019.live/data'
table_id = 'sortable_table_world'
Here we will look like a browser to the web site, as some web sites block their context to bots and crawlers. Since we are not hitting the web site a lot, pretending to be a browser is considered as acceptable usage.
We will send to the web site a header that a browser is sending and get the reply of the page as text. The text (r.text) will be parsed by the read_html function and create the dataframe. We will also add the HTML id of the table that we want. This id (‘sortable_table_world’) can be found when using the inspect option in Chrome, Safari, Firefox and other browsers.
import requests

header = {
  "User-Agent": "Mozilla/5.0 (X11; Linux x86_64) AppleWebKit/537.36 (KHTML, like Gecko) Chrome/50.0.2661.75 Safari/537.36",
  "X-Requested-With": "XMLHttpRequest"
}

response = requests.get(url, headers=header)

df_list = (
  pd
  .read_html(
    response.text,
    attrs={'id': table_id}
  )
)
df_list[0]
| Name | Confirmed | Per Million | Deceased | Per Million.1 | Tests | Active | Recovered | Per Million.2 | Vaccinated | Population | |
|---|---|---|---|---|---|---|---|---|---|---|---|
| 0 | TOTAL | 527,450,948 +453,711 | 66535.988 | 6,300,159 +398 | 794.742 | 6,356,859,452 +521,215 | 37819979 | 483,231,537 +443,455 | 60957.873 | 5173118206 | 7927303146 |
| 1 | ★ Afghanistan | 179,716 +42 | 4428.960 | 7,698 +1 | 189.710 | 958454 | 9277 | 162741 | 4010.630 | 5359930 | 40577445 |
| 2 | ★ Albania | 275,864 +26 | 96056.770 | 3497 | 1217.670 | 1822887 | 242 | 272125 | 94754.840 | 1302093 | 2871885 |
| 3 | ★ Algeria | 265,854 +3 | 5863.480 | 6875 | 151.630 | 230861 | 80593 | 178386 | 3934.350 | 7840131 | 45340682 |
| 4 | ★ Andorra | 42572 | 0.000 | 153 | 0.000 | 249838 | 662 | 41757 | 0.000 | 57874 | 77498 |
| ... | ... | ... | ... | ... | ... | ... | ... | ... | ... | ... | ... |
| 228 | ★ Western Sahara | 10 | 0.000 | 1 | 0.000 | Unknown | Unknown | 9 | 0.000 | Unknown | 624963 |
| 229 | ★ Niue | 9 | 0.000 | Unknown | 0.000 | Unknown | Unknown | 9 | 0.000 | 1650 | 1647 |
| 230 | ★ Nauru | 8 | 0.000 | Unknown | 0.000 | Unknown | Unknown | 5 | 0.000 | 9464 | 10952 |
| 231 | ★ Saint Helena | 2 | 0.000 | Unknown | 0.000 | Unknown | Unknown | 2 | 0.000 | 4361 | 6111 |
| 232 | ★ China | 223,145 +169 | 155.030 | 5,222 +3 | 3.630 | 160000000 | 4405 | 213,518 +476 | 148.350 | 1287195000 | 1439323776 |
233 rows × 11 columns
covid_19_status = df_list[0]
Simple Data Visualization
External data is often “messy”, and it is a best practice to clean it up before staring to work with it. In the next cell we will make sure that the numeric columns are indeed numeric (removing “Unknown”, for example). We will also resolve the conflict of having multiple columns with the same name (“Per Million”, in this exammple), and translate to more meaningful names.
Start with the Covid-19 status table
Convert the first ‘Per Million’ column from the table to be numeric
Convert the second ‘Per Million’ column from the table to be numeric
Fill missing values in the table with 0
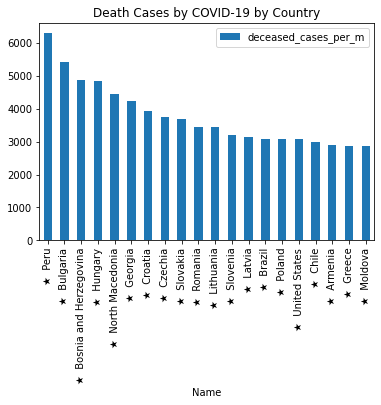
Sort the table in decreasing order by number of deceased cases
Take the first top 20 country rows
Plot the results
as bar graph with the name of the country and the number of deceased cases per million people
(
    covid_19_status
    .assign(confirmed_cases_per_m=lambda x: pd.to_numeric(x['Per Million'],  errors='coerce'))
    .assign(deceased_cases_per_m=lambda x: pd.to_numeric(x['Per Million.1'],  errors='coerce'))
    .fillna(0)
    .sort_values(by='deceased_cases_per_m',ascending=False)
    .iloc[:20,:]
    .plot
    .bar(
        x='Name',
        y='deceased_cases_per_m',
        title='Death Cases by COVID-19 by Country')
);
More examples
Using Functions
Functions are a more complicated topic and you are not expected to write functions most of the times. Functions are also available in Excel as Macros. You should be familiar with using functions, read them to understand what they do, and also modifying them to fit your needs.
We often find the a set of commands is repeating itself many times in our analyses. This is the time to wrap these commands as a function. In the next cell, we will create a function that is wrapping a few of the commands that we used in the previous cells such as choosing a specific index of a table from the table list and setting the first row as header.
Read the HTML content of the given URL
Parse the HTML and extract all the tables in it
Take the first (of other given index) table from that list
Set the header of the table from the values in the first row
Skip the first (header) row
Return that table
def get_table_from_html(url, attrs=None, index=0):
    response = requests.get(url, headers=header)
    df_list = pd.read_html(response.text, attrs=attrs)
    df = df_list[index]
    df.columns = df.iloc[0]
    df = df[1:]
    return df
Once we have the function defined (def), we can try it in a simple way. Let’s say that we want to add to our CRM (Customer Relationship Management) system a new target market, as the consumer good companies (CPG). We find in the web a table with the top CPG companies for 2019.
url_top_companies = 'https://consumergoods.com/top-100-consumer-goods-companies-2019'
df = get_table_from_html(url_top_companies)
Let’s look at the table
df.style
| 0 | Rank/Company | Net Revenue ($M) | 1-Year Sales Growth | Key Product Categories |
|---|---|---|---|---|
| 1 | 1. Nestle SA* | $92,085 | 2.10% | Food, Beverage, Confectionery |
| 2 | 2. Procter & Gamble | $66,832 | 2.70% | Household Goods, Health & Beauty Aids, OTC Pharma |
| 3 | 3. PepsiCo | $64,661 | 1.80% | Food, Beverage |
| 4 | 4. Unilever N.V.* | $56,188 | -5.10% | Household Goods, Food, Health & Beauty Aids |
| 5 | 5. Anheuser-Busch InBev | $54,619 | -3.20% | Wine & Spirits |
| 6 | 6. Christian Dior* | $51,607 | 7.20% | Apparel/Footwear/Accessories, Wine & Spirits, Health & Beauty Aids |
| 7 | 7. LVMH Moët Hennessy Louis Vuitton* | $51,607 | 9.80% | Apparel/Footwear/Accessories, Wine & Spirits, Health & Beauty Aids |
| 8 | 8. JBS S.A.* | $44,587 | 11.30% | Food |
| 9 | 9. Tyson Foods | $40,052 | 4.70% | Food |
| 10 | 10. Nike Inc. | $36,397 | 6.00% | Apparel/Footwear/Accessories |
| 11 | 11. Imperial Brands PLC* | $33,641 | 0.90% | Tobacco |
| 12 | 12. 3M Co. | $32,765 | 3.50% | Household Goods |
| 13 | 13. Coca-Cola Co. | $31,856 | -10.00% | Beverage, Food |
| 14 | 14. L’Oreal* | $29,687 | 3.50% | Health & Beauty Aids |
| 15 | 15. Philip Morris International | $29,625 | 3.10% | Tobacco |
| 16 | 16. Danone* | $27,168 | -0.60% | Food, Beverage |
| 17 | 17. British American Tobacco PLC* | $26,993 | 25.20% | Tobacco |
| 18 | 18. Kraft Heinz | $26,259 | 0.70% | Food |
| 19 | 19. Mondelez International | $25,938 | 0.20% | Food, Confectionary |
| 20 | 20. Haier Smart Home Co. | $25,755 | 12.20% | Housewares/Appliances |
| 21 | 21. Altria Group | $25,364 | -0.80% | Tobacco |
| 22 | 22. Heineken Holding N.V.* | $24,765 | 3.90% | Wine & Spirits |
| 23 | 23. Adidas AG* | $24,153 | 3.30% | Apparel/Footwear/Accessories |
| 24 | 24. WH Group Ltd. | $22,605 | 1.00% | Food |
| 25 | 25. Henkel AG* | $21,931 | -0.60% | Household Goods, Health & Beauty Aids |
| 26 | 26. Whirlpool Corp. | $21,037 | -1.00% | Housewares/Appliances |
| 27 | 27. Japan Tobacco* | $20,565 | 3.60% | Tobacco |
| 28 | 28. Fonterra Cooperative Group | $20,438 | 6.30% | Food, Beverage |
| 29 | 29. Asahi Group Holdings* | $19,677 | 1.70% | Wine & Spirits, Beverages, Food |
| 30 | 30. BSH Hausgerate* | $19,667 | -3.00% | Housewares/Appliances |
| 31 | 31. San Miguel Corp.* | $19,652 | 24.10% | Wine & Spirits, Food |
| 32 | 32. Kimberly-Clark Corp. | $18,486 | 0.80% | Household Goods |
| 33 | 33. Kirin Holdings* | $17,916 | 3.60% | Wine & Spirits |
| 34 | 34. Associated British Foods* | $17,164 | 1.40% | Food |
| 35 | 35. General Mills | $15,740 | 0.80% | Food |
| 36 | 36. Colgate-Palmolive Co. | $15,544 | 0.60% | Household Goods |
| 37 | 37. Kering* | $15,060 | 26.30% | Apparel/Footwear/Accessories |
| 38 | 38. Grupo Bimbo* | $14,765 | 7.80% | Food |
| 39 | 39. Kao Corp.* | $13,995 | 1.30% | Household Goods, Health & Beauty Aids |
| 40 | 40. Stanley Black & Decker | $13,982 | 7.80% | Housewares/Appliances |
| 41 | 41. Johnson & Johnson (Consumer) | $13,853 | 1.80% | OTC Pharma, Household Goods, Health & Beauty Aids |
| 42 | 42. VF Corp. | $13,849 | 17.30% | Apparel/Footwear/Accessories |
| 43 | 43. Uni-President Enterprises* | $13,845 | 7.90% | Food |
| 44 | 44. Estee Lauder Companies | $13,683 | 15.70% | Health & Beauty Aids |
| 45 | 45. Kellogg Co. | $13,547 | 5.40% | Food |
| 46 | 46. Diageo PLC* | $13,405 | 0.90% | Wine & Spirits |
| 47 | 47. AB Electrolux* | $12,821 | 2.80% | Housewares/Appliances |
| 48 | 48. RB* | $12,597 | -0.20% | Household Goods |
| 49 | 49. Essity* | $12,239 | 8.40% | Household Goods |
| 50 | 50. Compagnie Financiere Richemont SA* | $12,100 | 3.10% | Apparel/Footwear/Accessories |
| 51 | 51. Nipponham Group* | $11,779 | 5.60% | Food |
| 52 | 52. Keurig Dr Pepper | $11,024 | 2.30% | Beverages |
| 53 | 53. MolsonCoors Brewing Co. | $10,770 | -2.10% | Wine & Spirits |
| 54 | 54. Shiseido Co.* | $10,160 | 8.90% | Health & Beauty Aids |
| 55 | 55. Pernod Ricard* | $9,905 | -0.30% | Wine & Spirits |
| 56 | 56. Nintendo Co.* | $9,797 | 115.80% | Toys & Games |
| 57 | 57. China Mengniu Dairy Co.* | $9,691 | 14.70% | Food |
| 58 | 58. PVH Corp. | $9,657 | 8.30% | Apparel/Footwear/Accessories |
| 59 | 59. Hormel Foods | $9,546 | 4.10% | Food |
| 60 | 60. Coty, Inc. | $9,398 | 22.80% | Health & Beauty Aids |
| 61 | 61. Carlsberg A/S* | $9,233 | 3.00% | Wine & Spirits |
| 62 | 62. Saputo Inc.* | $8,766 | 3.40% | Food |
| 63 | 63. Campbell Soup Co. | $8,685 | 10.10% | Food, Beverages |
| 64 | 64. Newell Brands | $8,631 | -9.60% | Household Goods, Housewares/Appliances |
| 65 | 65. Swatch Group SA* | $8,535 | 6.10% | Apparel/Footwear/Accessories |
| 66 | 66. BRF - Brasil Foods* | $8,474 | 3.20% | Food |
| 67 | 67. GlaxoSmithKline Consumer Healthcare* | $8,440 | -1.20% | OTC Pharma |
| 68 | 68. Beiersdorf AG* | $7,972 | 2.50% | Household Goods, Health & Beauty Aids |
| 69 | 69. Conagra Brands | $7,938 | 1.40% | Food |
| 70 | 70. Hershey Co. | $7,791 | 3.70% | Food, Confectionery |
| 71 | 71. Dean Foods Co. | $7,755 | -0.50% | Food, Beverages |
| 72 | 72. Constellation Brands | $7,585 | 3.50% | Wine & Spirits |
| 73 | 73. Groupe SEB* | $7,508 | 5.10% | Housewares/Appliances |
| 74 | 74. Thai Beverage Public Co.* | $7,496 | 20.90% | Wine & Spirits, Food, Beverages |
| 75 | 75. J.M. Smucker Co. | $7,357 | -0.50% | Food |
| 76 | 76. PT Gudang Garam* | $6,805 | 14.90% | Tobacco |
| 77 | 77. Hanesbrands | $6,804 | 5.10% | Apparel/Footwear/Accessories |
| 78 | 78. Hermes International* | $6,575 | 7.50% | Apparel/Footwear/Accessories |
| 79 | 79. Unicharm Corp.* | $6,388 | 7.30% | Household Goods |
| 80 | 80. Bandai Namco Holdings* | $6,295 | 9.40% | Toys & Games |
| 81 | 81. Post Holdings | $6,257 | 19.80% | Food |
| 82 | 82. Ralph Lauren Corp. | $6,182 | -7.10% | Apparel/Footwear/Accessories |
| 83 | 83. Clorox Co. | $6,124 | 2.50% | Household Goods |
| 84 | 84. Bayer Consumer Health* | $6,006 | -7.00% | OTC Pharma |
| 85 | 85. Tapestry Inc. | $5,880 | 31.00% | Apparel/Footwear/Accessories |
| 86 | 86. McCormick & Co. | $5,409 | 11.90% | Food |
| 87 | 87. Savencia SA | $5,360 | 0.20% | Food |
| 88 | 88. Kewpie Corp.* | $5,323 | 2.10% | Food |
| 89 | 89. Avon Products | $5,248 | -5.70% | Health & Beauty Aids, Apparel/Footwear/Accessories, Household Goods |
| 90 | 90. Electronic Arts | $5,150 | 6.30% | Toys & Games |
| 91 | 91. First Pacific Co. | $5,136 | -1.90% | Food |
| 92 | 92. ITC Ltd.* | $5,048 | -22.00% | Tobacco, Food, Health & Beauty Aids |
| 93 | 93. Herbalife Ltd. | $4,892 | 10.50% | Food, Household Goods, Health & Beauty Aids |
| 94 | 94. Sapporo Holdings Ltd.* | $4,843 | -5.40% | Wine & Spirits, Food, Beverages |
| 95 | 95. Arcelik A.S.* | $4,665 | 29.10% | Housewares/Appliances |
| 96 | 96. Hasbro Inc. | $4,580 | -12.10% | Toys & Games |
| 97 | 97. Mattel Inc. | $4,511 | -7.60% | Toys & Games |
| 98 | 98. Husqvarna AB* | $4,244 | 4.30% | Housewares/Appliances |
| 99 | 99. Church & Dwight Co. | $4,146 | 9.80% | Household Goods, Health & Beauty Aids |
| 100 | 100. Spectrum Brands Holdings | $3,809 | 2.80% | Household Goods, Housewares/Appliances |
Cleaning the data
We see that the table has a column with both the rank and the name of the company, and we want to have only the name of company in a column (as we have the rank in the index of the table). There are a fwe options to do it using string functions such as RIGHT or LEFT. In this case, you could use:
RIGHT(cell,LEN(cell)-SEARCH("char", cell))
In this example, we will use a powerful tool of regular expression (regex). We will not dive into the syntax of regex now, and it time you will find it easier to read or even write.
clean_names_df = (
    df
    .assign(company_name = lambda x : x['Rank/Company'].str.extract(r'\d+. ([^*]*)[*]?'))
)
The next manipulation that we want to do is to have a numeric column with the annual revenues. The data in the table is in millions (which is better for presentation purposes). We will run two manipulations on the data:
Start with the clean verion of the table data frame above
Remove the dollar sign ($) and the comma (,) from the ‘Net Revenue’ Column
Convert the above value to number and scale it to dollars by multipling by a million
clean_names_df = (
    clean_names_df
    .assign(annual_num = lambda x : x['Net Revenue ($M)'].replace('[\$,]', '', regex=True))
    .assign(annual_revenues = lambda x : pd.to_numeric(x.annual_num)*10**6)
)
clean_names_df.head()
| Rank/Company | Net Revenue ($M) | 1-Year Sales Growth | Key Product Categories | company_name | annual_num | annual_revenues | |
|---|---|---|---|---|---|---|---|
| 1 | 1. Nestle SA* | $92,085 | 2.10% | Food, Beverage, Confectionery | Nestle SA | 92085 | 92085000000 |
| 2 | 2. Procter & Gamble | $66,832 | 2.70% | Household Goods, Health & Beauty Aids, OTC Pharma | Procter & Gamble | 66832 | 66832000000 |
| 3 | 3. PepsiCo | $64,661 | 1.80% | Food, Beverage | PepsiCo | 64661 | 64661000000 |
| 4 | 4. Unilever N.V.* | $56,188 | -5.10% | Household Goods, Food, Health & Beauty Aids | Unilever N.V. | 56188 | 56188000000 |
| 5 | 5. Anheuser-Busch InBev | $54,619 | -3.20% | Wine & Spirits | Anheuser-Busch InBev | 54619 | 54619000000 |
Enriching the data
The next column we want to add to our table before importing it to our CRM system is domain of the company. We will need to use for it a search engine such as Google and a python library that is wrapping it to make it easy for us to use it. First, let’s install the python library:
pip install google
Collecting google
  Downloading google-3.0.0-py2.py3-none-any.whl (45 kB)
?25l     ━━━━━━━━━━━━━━━━━━━━━━━━━━━━━━━━━━━━━━━━ 0.0/45.3 kB ? eta -:--:--
     ━━━━━━━━━━━━━━━━━━━━━━━━━━━━━━━━━━━━━━━━ 45.3/45.3 kB 5.5 MB/s eta 0:00:00
?25hRequirement already satisfied: beautifulsoup4 in /opt/hostedtoolcache/Python/3.7.13/x64/lib/python3.7/site-packages (from google) (4.11.1)
Requirement already satisfied: soupsieve>1.2 in /opt/hostedtoolcache/Python/3.7.13/x64/lib/python3.7/site-packages (from beautifulsoup4->google) (2.3.2.post1)
Installing collected packages: google
Successfully installed google-3.0.0
WARNING: There was an error checking the latest version of pip.
Note: you may need to restart the kernel to use updated packages.
Now, let’s try it on one of the company names
from googlesearch import search
for url in search('Nestle', stop=1):
    print(url)
https://www.nestle.com/
The above cell is using a powerful concept in programming called for-loop or list-comprehesion. However, we will try to minimize this programming concept and convert it to a simpler command that is returning the first value
next(search('Hasbro Inc.', stop=1),'Nope')
'https://shop.hasbro.com/en-us'
Search Domain Function
Now we can see the following function that will return to us the domain name of every company we will call it. The function is using various complicated concepts such as regex that we already saw, and try-except part which is used to handle errors (what happened if we don’t find a domain name). The function is also waiting 20 seconds before calling the search engine to avoid exceeding some limits that systems are putting against bots (which we just created). The sleep will make the actual run of the data much longer, but it is still automated and we don’t need to run this repeative task manually.
For now, we don’t need to understand these details:
Wait 20 seconds between calls to avoid throttling by Google
Search for the website of the name of the company and return the first result
Extract the format of the http or https of the above result
Take the first match
Return the match or ‘NA’ if not found
import re
import time

def search_domain(company_name):
    time.sleep(20)
    try:
        domain = next(search(str(company_name)+' website', stop=1))
        m = re.search('https?://.*?\.?([0-9a-z-]+\.co[^/]+)/.*', domain)
        answer = m.group(1)
    except:
        answer = 'NA'
    return answer
Let’s test it with one of the compamy names
search_domain('3M co.')
'3m.com'
Now it is time to call our search_domain function on all the rows in our table. This will take an hour or so, due to our sleep time between the calls. For now, let’s run it only on the head (first 5) of the table.
clean_names_df_head = clean_names_df.head()
clean_names_df_head['domain'] = (
    clean_names_df_head
    .company_name
    .apply(search_domain)
)
clean_names_df_head
| Rank/Company | Net Revenue ($M) | 1-Year Sales Growth | Key Product Categories | company_name | annual_num | annual_revenues | domain | |
|---|---|---|---|---|---|---|---|---|
| 1 | 1. Nestle SA* | $92,085 | 2.10% | Food, Beverage, Confectionery | Nestle SA | 92085 | 92085000000 | nestle.com |
| 2 | 2. Procter & Gamble | $66,832 | 2.70% | Household Goods, Health & Beauty Aids, OTC Pharma | Procter & Gamble | 66832 | 66832000000 | pg.com |
| 3 | 3. PepsiCo | $64,661 | 1.80% | Food, Beverage | PepsiCo | 64661 | 64661000000 | pepsico.com |
| 4 | 4. Unilever N.V.* | $56,188 | -5.10% | Household Goods, Food, Health & Beauty Aids | Unilever N.V. | 56188 | 56188000000 | unilever.com |
| 5 | 5. Anheuser-Busch InBev | $54,619 | -3.20% | Wine & Spirits | Anheuser-Busch InBev | 54619 | 54619000000 | ab-inbev.com |
Writing to CSV/Excel file
Once we finished our table creation, we can write it as a file that we can later import to our CRM system.
(
    clean_names_df
    .to_csv(
        '../data/top_100_cpg_companies.csv',
        index=False
        )
)